Tuesday, 25 July 2023

Software Design: Transform Analysis


Software Design: Transform Analysis


Transform Analysis

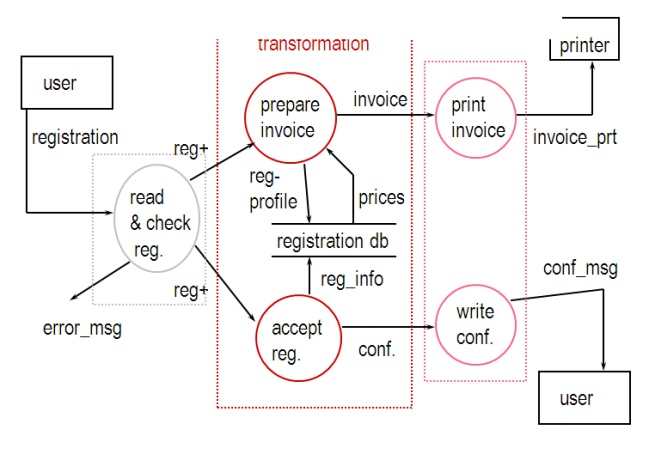
 Transform analysis is strategy of converting each piece of DFD (may be from level 2 or level 3, etc.) for all the identified transaction centers. Draw a DFD of a transaction type (usually done during analysis phase)

 ·        Find the central functions of the DFD

 ·        Convert the DFD into a first-cut structure chart
 ·        Refine the structure chart

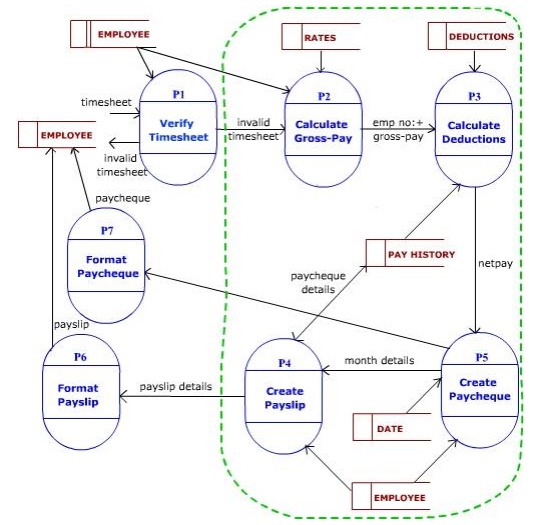
 ·        Verify that the final structure chart meets the requirements of the original DFD Let us understand these steps through a payroll system example:


   Identifying the central transform

The central transform is the portion of DFD that contains the essential functions of the system and is independent of the particular implementation of the input and output. One way of identifying central transform (Page-Jones, 1988) is to identify the Centre of the DFD by pruning off its afferent and efferent branches. Afferent stream is traced from outside of the DFD to a flow point inside, just before the input is being transformed into some form of output (For example, a format or validation process only refines the input – does not transform it). Similarly, an efferent stream is a flow point from where output is formatted for better presentation. The processes between afferent and efferent stream represent the central transform (marked within dotted lines above). In the above example, P1 is an input process, and P6 & P7 are output processes. Central transform processes are P2, P3, P4 & P5 - which transform the given input into some form of output.


First-cut Structure Chart


To produce first-cut (first draft) structure chart, first we have to establish a boss module. A boss module can be one of the central transform processes. Ideally, such process has to be more of a coordinating process (encompassing the essence of transformation). In case we fail to find a boss module within, a dummy coordinating module is created


In the above illustration, we have a dummy boss module ―Produce Payroll‖ – which is named in a way that it indicates what the program is about. Having established the boss module, the afferent stream processes are moved to left most side of the next level of structure chart; the efferent stream process on the right most side and the central transform processes in the middle. Here, we moved a module to get valid timesheet (afferent process) to the left side (indicated in yellow). The two central transform processes are move in the middle (indicated in orange). By grouping the other two central transform processes with the respective efferent processes, we have created two modules (in blue) – essentially to print results, on the right side.The main advantage of hierarchical (functional) arrangement of module is that it leads to flexibility in the software. For instance, if ―Calculate Deduction‖ module is to select deduction rates from multiple rates, the module can be split into two in the next level – one to get the selection and another to calculate. Even after this change, the ―Calculate Deduction‖ module would return the same value.

·        Refine the Structure Chart

Expand the structure chart further by using the different levels of DFD. Factor down till you reach to modules that correspond to processes that access source / sink or data stores. Once this is ready, other features of the software like error handling, security, etc. has to be added. A module name should not be used for two different modules. If the same module is to be used in more than one place, it will be demoted down such that ―fan in‖ can be done from the higher levels. Ideally, the name should sum up the activities done by the module and its sub-ordinates.


·        Verify Structure Chart vis-à-vis with DFD

Because of the orientation towards the end-product, the software, the finer details of how data gets originated and stored (as appeared in DFD) is not explicit in Structure Chart. Hence DFD may still be needed along with Structure Chart to understand the data flow while creating low-level design.
·        check the list of properties for transform flow characteristics

·        be aware that this is a guideline only

            Step 2b:

 ·        find and mark the center of transformation in the DFD

 ·        locate the center of transformation

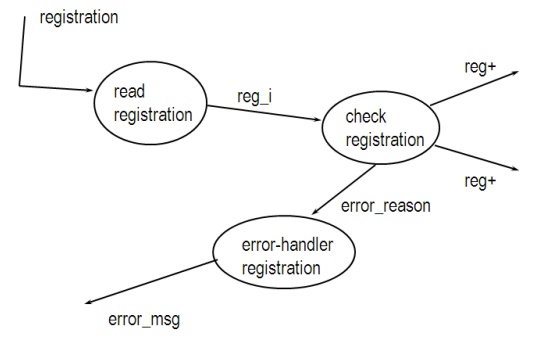
 ·        follow input-driven flows into the center until the data is in an internal format, correct and 

       complete ===> mark position

 ·        trace back output-driven flows to the center until the data is complete and ready for presentation, but not         yet in external format ===> mark position

 ·        connect all markings: center of transformation


 ·        add data (and control) flows

 ·        further decompose (factor) were necessary

 ·        user interface handling modules

 ·        error-handling modules

 ·        add initialization & termination modules

 ·        check quality of design:

 ·        cohesion

 ·        coupling

 ·        reconfirm mapping with DFD


Friday, 21 July 2023

Business Process Modeling Notation(BPMN


What is Business Process Modeling Notation

What are your requirements regarding BPMN diagrams?

What is BPMN?

Business Process Modeling Notation (BPMN) is a flow chart method that models the steps of a planned business process from end to end. A key to Business Process Management, it visually depicts a detailed sequence of business activities and information flows needed to complete a process.

bpmn example

Its purpose is to model ways to improve efficiency, account for new circumstances or gain competitive advantage. The method has been undergoing a standardization push in the past few years and is now often called by a slightly different name: Business Process Model and Notation, still using the BPMN acronym. It differs from Unified Modeling Language (UML) used in software design.

Very recent history

Business Process Modeling Notation was developed by the Business Process Management Initiative (BPMI) and has gone through a series of revisions. In 2005, that group merged with the Object Management Group (OMG), which took over the initiative. In 2011, OMG released BPMN 2.0 and changed the method’s name to Business Process Model and Notation. It created a more detailed standard for business process modeling, using a richer set of symbols and notations for Business Process Diagrams. Since 2014, BPMN has also been complemented by a decision flow chart method called the Decision Model and Notation standard, since BPMN doesn’t naturally lend itself to decision flows.

Purpose and benefits

At a high level, BPMN is targeted at participants and other stakeholders in a business process to gain understanding through an easy-to-understand visual representation of the steps. At a more involved level, it’s targeted at the people who will implement the process, giving sufficient detail to enable precise implementation. It provides a standard, common language for all stakeholders, whether technical or non-technical: business analysts, process participants, managers and technical developers, as well as external teams and consultants. Ideally, it bridges the gap between process intention and implementation by providing sufficient detail and clarity into the sequence of business activities.

The diagramming can be far easier to understand than narrative text would be. It allows for easier communication and collaboration to reach the goal of an efficient process that produces a high-quality result. It also helps with communication leading to XML (Extensible Markup Language) documents needed to execute various processes. One main XML standard is called BPEL or BEPEL4WS, standing for Business Process Execution Language for Web Services.

BPMN 2.0 diagram elements and symbols

BPMN depicts these four element types for business process diagrams:


  1. Flow objects: eventsactivitiesgateways
  2. Connecting objects: sequence flow, message flow, association
  3. Swimlanes: pool or lane
  4. Artifacts: data object, group, annotation

These are the individual elements and how they are used to define a business process:

Events

A trigger that starts, modifies or completes a process. Event types include message, timer, error, compensation, signal, cancel, escalation, link and others. They are shown by circles containing other symbols based on event type. They are classified as either “throwing” or “catching,” depending on their function.

bpmn event symbols

Activity

A particular activity or task performed by a person or system. It’s shown by a rectangle with rounded corners. They can become more detailed with sub-processes, loops, compensations and multiple instances.

BPMN activity symbols

Gateway

Decision point that can adjust the path based on conditions or events. They are shown as diamonds. They can be exclusive or inclusive, parallel, complex, or based on data or events.

BPMN gateway symbols


Sequence flow

Shows the order of activities to be performed. It is shown as a straight line with an arrow. It might show a conditional flow, or a default flow.

sequence flow bpmn

Message flow

Depicts messages that flow across “pools,” or organization boundaries such as departments. It shouldn’t connect events or activities within a pool. It is represented by a dashed line with a circle at the start and an arrow at the end.

message flow bpmn

Association

Shown with a dotted line, it associates an artifact or text to an event, activity or gateway.

bpmn association symbol

Pool and swimlane

A pool represents major participants in a process. A different pool may be in a different company or department but still involved in the process. Swimlanes within a pool show the activities and flow for a certain role or participant, defining who is accountable for what parts of the process.

bpmn swimlane symbol

Artifact

Additional information that developers add to bring a necessary level of detail to the diagram. There are three types of artifacts: data object, group or annotation. A data object shows what data is necessary for an activity. A group shows a logical grouping of activities but doesn’t change the diagram’s flow. An annotation provides further explanation to a part of the diagram.

bpmn artifact symbols

Who does business process modeling?

Business Process Modeling can range from simple, hand-drawn diagrams to more involved ones with expandable elements to provide sufficient implementation detail. At its most sophisticated, BPMN is conducted by credentialed analysts. The Object Management Group (OMG) provides OCEB 2, which stands for OMG-Certified Expert in BPM 2.0. One track is business-oriented, and the other is technical. OMG intends for BPMN 2.0 to standardize business process modeling in the same way that Unified Modeling Language (UML) standardized software modeling.

BPMN requires a commitment of time and energy, but the payoff in understanding and improvement can be huge. Version 2.0 builds on previous versions by providing a richer standard set of symbols and notations, allowing more detail for those who need it.

The idea behind Business Process Management is to create a life cycle of continuous improvement. The steps are model, implement, execute, monitor and optimize. BPMN diagrams play a key role in that.

Sub-models within a BPMN diagram

The diagrams are used to communicate with diverse audiences, both non-technical and technical. Sub-models allow the diverse viewers to easily differentiate between sections of the diagram, finding what’s most applicable to them. The types of sub-models are:

  • Private business processes. These are internal to a specific organization and don’t cross pools, or organizational boundaries.
  • Abstract business processes. These occur between a private/internal process and another participant or process. The abstract process shows the outside world the sequence of messages needed to interact with the private process. It doesn’t show the private/internal process itself.
  • Collaboration business processes. These show the interactions between two or more business entities.

Other diagram types

In BPMN 2, there are these other diagram types: conversation, choreography and collaboration.

  • Choreography diagram: Shows interactions between two or more participants. It also may be expanded with sub-choreographies.
  • Collaboration diagram: Shows interactions between two or more processes, using more than one pool. All combinations of pools, processes and choreography may be used in a collaboration diagram.
  • Conversation diagram: In general, this is a simplified version of a collaboration diagram. It shows a group of related message exchanges in a business process. It may be expanded with sub-conversations.

Key tips for business process modeling

  1. Clearly define the scope of the process with a beginning and end.
  2. You might first map the current business process to highlight inefficiencies before modeling a better way with BPMN.
  3. Aim for BPMN diagrams that fit on one page, even if the page is poster-sized, as some are.
  4. Lay out sequence flows horizontally. Show associations and data flows vertically.
  5. You can create different versions of the diagram for different stakeholders, depending on the level of detail needed for their role.
  6. BPMN is not appropriate for modeling organizational structures, functional breakdowns, or data flow models. Although BPMN depicts some information flows in business processes, it’s not a Data Flow Diagram (DFD.)


Software Design: Transform Analysis